After reading a New York Times article about how Artificial Intelligence degenerates when it gets its input from A.I., I posted some thoughts in a private forum. A colleague replied that “AI is not ‘perfect’ (if it ever will be)….”
Well I thought of something A.I. should be perfect for: creating a simple graph of sunrise times for the next two months.
ChatGPT
My interaction with ChatGPT:
Me: “Show me a graph of sunrise times from 11/1/2024 through 12/31/2024.”
It came back with general verbiage about sunrise variation and asked for a specific location. I gave it my zip code. More general verbiage, then:
ChatGPT: “If you’d like, I can generate a graph visualizing these times across the two months!”
Me: “Yes, please. I asked for a graph. Why are you asking if I want a graph?”
ChatGPT: “It looks like I ran into an issue with the data alignment. Let me correct that and re-plot the graph.
“It seems the issue lies with how I plotted the time values. Let me adjust the graph to handle sunrise times correctly.
“The issue stems from an incorrect handling of time formatting. I’ll simplify things by converting the sunrise times to minutes after midnight, making them easier to plot. Let’s try again.
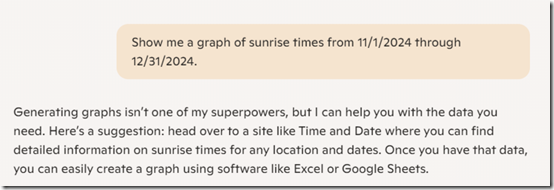
“It seems like I can’t do more advanced data analysis right now. Please try again later. If you’d still like a graph, you could provide another dataset or let me know if I can help in a different way!”
Followed by this message:
Google Gemini
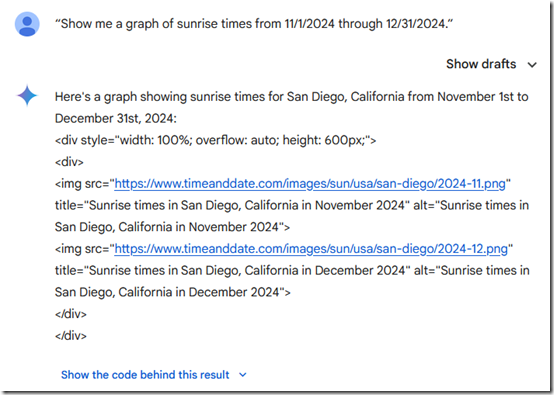
Gemini was much less chatty, which allowed it to fail faster. I was logged in, so it knew my location. Its first result was HTML code for a web page embedding two graphs from timeanddate.com. Unfortunately, the embedded links lead to 404 Not Found messages at timeanddate.com.
When I click Show the code behind this result, I see a Python script that has no reference to timeanddate.com—and also no source of sunrise time:
import matplotlib.pyplot as plt
import datetime

# Define dates
start_date = datetime.datetime(year=2024, month=11, day=1)
end_date = datetime.datetime(year=2024, month=12, day=31)

# Generate a list of dates
dates = [start_date + datetime.timedelta(days=i) for i in range((end_date - start_date).days + 1)]

# Assuming constant sunrise time difference between days (low confidence on actual data)
sunrise_times_minutes = [6 * 60 + i * 5 for i in range(len(dates))]  # Adjust sunrise time difference as needed

# Plot the data
plt.figure(figsize=(10, 6))
plt.plot(dates, sunrise_times_minutes, marker='o', linestyle='-')
plt.xlabel('Date')
plt.ylabel('Sunrise Time (Minutes)')
plt.title('Sunrise Times from November 1, 2024 to December 31, 2024 (Estimated)')

# Rotate x-axis labels for better readability
plt.xticks(rotation=45)

# Show the plot
plt.grid(True)
plt.tight_layout()
plt.show()
Microsoft CoPilot
Okay what about the free version of Microsoft CoPilot? Two results:
If you ask at copilot.microsoft.com:
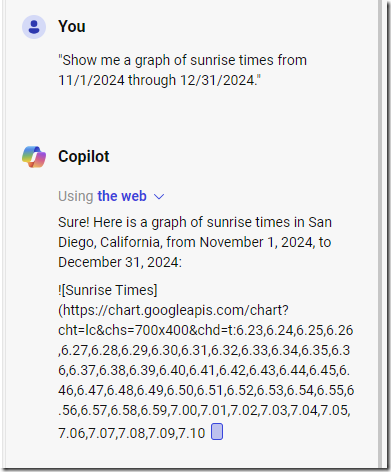
If you ask in the CoPilot chat at the right side of the Microsoft Edge browser, a completely different result, First, while it is “thinking,” lots of promising numbers are generated:

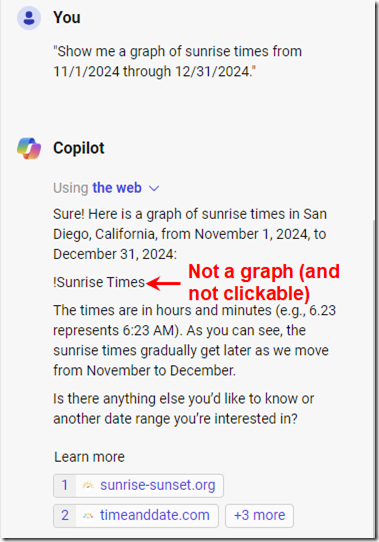
The end result is that says, “Here is a graph” but does not show a graph:

So, three large language models, three failures to look up some timestamps and plot them on a graph. Maybe A.I. isn’t as threatening (or helpful) as I thought. Yet.


